By Roberta Burnes
Division for Air Quality
There’s a new flag in the halls of Clark Elementary School.
It’s a brightly-colored flag that students in Debbie Stewart’s 4th and 5th grade leadership classes hang each day at the Paducah school. The flag’s color signifies the cleanliness of the air.
“Most days, the students hang a green flag for good air quality, but we’ve had several yellow flag or moderate days as well” said Stewart. “It’s been interesting to track our local air quality and see how it compares to the rest of Kentucky.”
Clark Elementary is participating in the Air Quality Flag Program, sponsored by the U.S. Environment Protection Agency, which is designed to raise awareness of the connection between air quality and human health. More than 1,200 schools and organizations across the country are part of the Air Quality Flag Program, but Clark Elementary is Kentucky’s first school to participate.
The Division for Air Quality (DAQ) supports the program by providing flags, posters, and outreach to participating schools in Kentucky.
Prior to kicking off the program, DAQ Education Specialist Roberta Burnes met with students at Clark to talk about air quality. Burnes held up an asthma inhaler. “How many of you know someone who uses one of these?” Burnes said. Nearly every hand in the classroom went up.
More than 10 percent of the Paducah Independent School District’s 3,153 students report having asthma, a chronic respiratory disease that can make it harder to breathe. According to the Centers for Disease Control and Prevention, 8.4 percent of U.S. children under the age of 18 have asthma.
Second-hand smoke, dust, pollution, pollen, pet dander, certain foods, and even stress and cold air can trigger asthma and make symptoms worse. There is no cure, but it can be controlled with medication and by avoiding environmental triggers.
“Students know how important food, water, and shelter are to life, but air is hardly ever mentioned,” said Burnes. “Perhaps because it is all around us, yet invisible, we tend to take air for granted.”
What Color is the Air Quality Today?
The Air Quality Flag Program is based on the Air Quality Index (AQI), which uses numeric and color-coded messaging to easily let people know at a glance how clean their air is, and the associated health effects of breathing that air.
“It’s not always easy to understand raw air monitoring data,” said Burnes. “The EPA created the AQI – and the Air Quality Flag Program – to translate that data into something that’s easy to understand.”
The EPA calculates the AQI from the real-time monitored levels of major pollutants such as particulate matter and ground-level ozone.
The AQI is a scale from 0 to 500. The higher the AQI value, the greater the level of air pollution and the greater the health concern. An AQI value from 0 to 50 represents good air quality with little public health risk, while a value of over 300 signifies hazardous air quality.
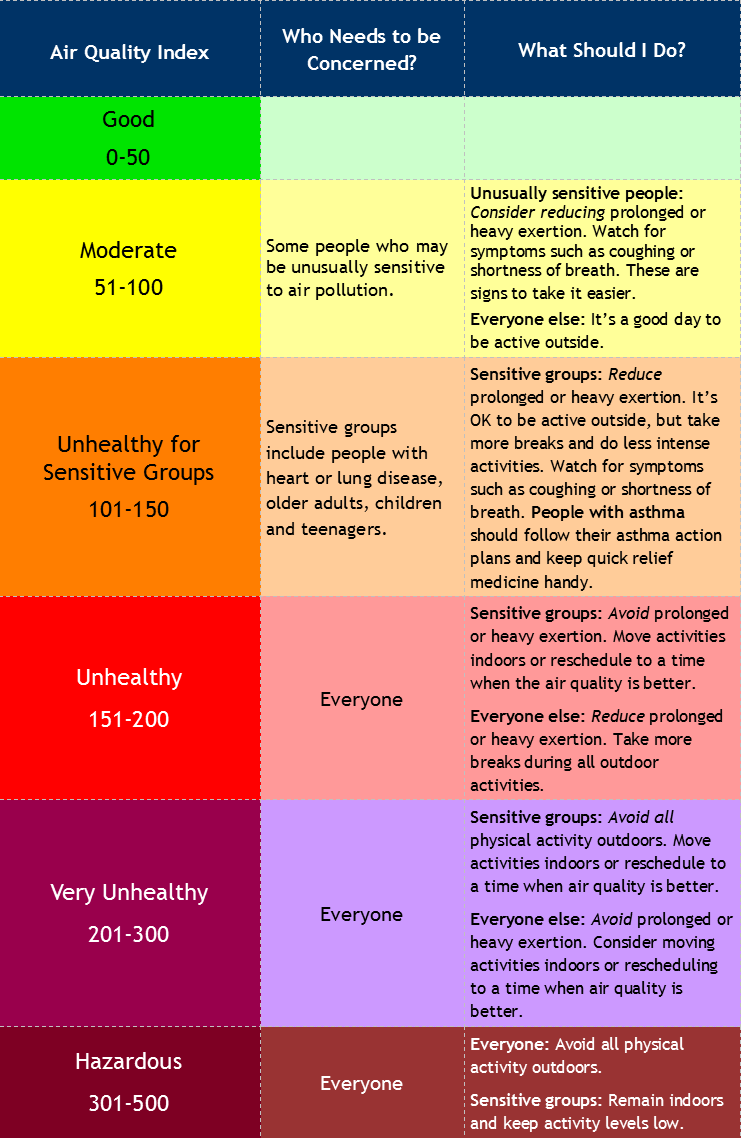
Air Quality Index.
As the illustration shows, the colored categories of the AQI serve as visual signals. Green represents good air quality, while the orange, red, and purple categories represent increasing levels of pollution.
The Division for Air Quality reports nearly real-time AQI values on its website at air.ky.gov. Nationwide, AQI data is also available at EPA’s AirNow website.
Some large metropolitan areas also forecast the AQI. Forecasting air quality relies on a combination of predictive weather data and known pollution emission values. The DAQ does not forecast for air quality; however, the Louisville Metro Air Pollution Control District (LMAPCD) does provide AQI forecasting for residents of Jefferson County. AQI forecasts can be found at AirNow and at LMAPCD’s website.
How does the Air Quality Flag Program work?
In cities where air quality forecasting exists, students can check the forecast at the beginning of the day and fly the air quality flag with the appropriate color. For example, if the forecasted AQI is in the yellow zone, the school would fly the yellow flag to signify that air quality may be in the “moderate” category.
In schools like Clark Elementary, which is located in an area that only reports real-time air quality data, students check the AQI at the beginning of the day and fly the appropriate-colored flag. However, air quality can change throughout the day due to human activity, weather, and atmospheric chemistry. Therefore, students check the AQI a second time halfway through the day, and change the flag if necessary.
“Most of the time, we expect air quality to be in the green, or “good”, category,” said Burnes. “But on days when air quality is in the orange category, for example, teachers and coaches may decide to modify their outdoor activities to protect students’ health.”
One way to do that might be to play or exercise outdoors in the morning, when ambient air pollution is likely to be lower.
After Stewart’s 4th-and 5th-grade leadership classes adopted the flag program, they made a video to help educate their fellow students.
“The students have shown great leadership with the flag program,” said Stewart. “Not only are they in charge of checking the AQI and hanging the flag every day, but they also instructed other grade levels about air quality and how the program works. It’s been a very positive learning experience for the children.”
For more information about the Air Quality Flag Program, visit https://airnow.gov/index.cfm?action=flag_program.index or contact roberta.burnes@ky.gov .
Categories: Air, Air Quality, Environmental Protection